Figure 1: A graph (Copyright © 2016 Timothy Hobbs, CC BY-SA 4.0)
I wanted to write a manual for the textgraph ecosystem. I thought it would be rather short. The file format is trivial and the utilities are only a few lines of code. But despite the simplicity of it all, I felt like I was describing the use of a hammer to an audience which had never seen a nail. In person, I would tell people about how the myopic graph editor lets you effectively edit and manipulate graph data and they would look at me quizzically and ask themselves "Why would I want to manipulate graph based data?" Or worse, "what is a graph?" Thus I find myself writing, not a manual, but a traveler’s guide to the world of graphs.
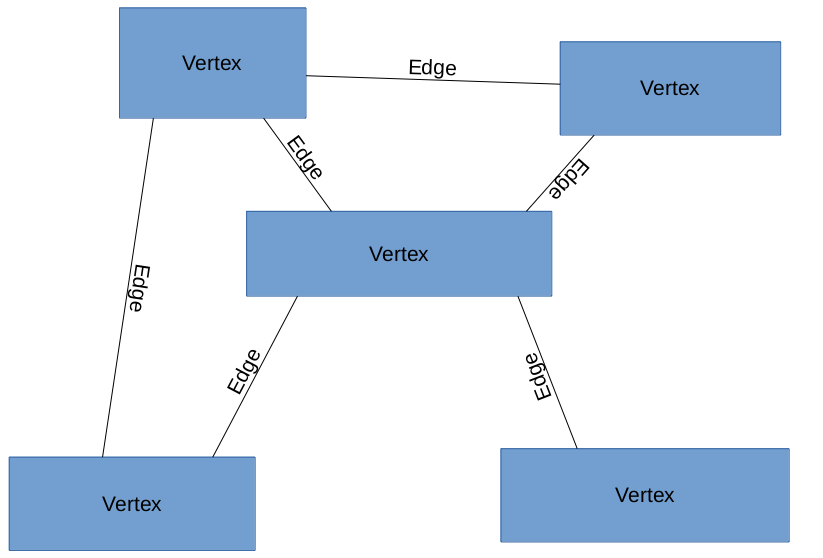
A graph is illustrated in Figure 1. When I use the word graph, I am not referring to bar charts. In mathematics, graphs are a kind of network. A graph is a collection of vertexes which are connected by edges. You can think of vertexes as train stations and edges as rail lines. A vertex can be anything and an edge is just a connection between one vertex and another.
This is a book about graphs. I will discuss the myriad of ways that they can be, and have been, used to represent data, calculations, and systems. I will also discuss basic philosophical questions, such as "what is data", "what is a calculation" and "what is a system?" Finally, I will discuss ways of manipulating digital representations of graphs using the textgraph ecosystem and I will present concrete examples of how you can use digital representations of graphs to enhance your understanding of the programs you write and improve automation and code reuse.